Smart Dollar Cost Averaging for better returns in the crypto market


Photo by André François McKenzie on Unsplash
PermalinkTL;DR
DCA (Dollar Cost Averaging) is a simple investment strategy that doesn't require any particular effort or prior trading knowledge and protects the investor from any short term volatility of the asset. Simplicity comes with the downside of not taking into account the environment and all of its information, which could be used to spot good or bad opportunities to enter the market and make more intelligent buys.
In this article, I explore the effects on our wallet value of using a simple heuristic that combines DCA with the Fear and Greed Index in the following way:
When it's DCA day:
- If F&G indicates "Extreme Fear", buy 2x the DCA amount
- If F&G indicates "Fear", buy 1.5x the DCA amount
- If F&G indicates "Neutral", buy the default DCA amount
- If F&G indicates "Greed", buy 0.5x the DCA amount
- If F&G indicates "Extreme Greed", do not buy.
This strategy is backtested on BTCUSD and ETHUSD pairs, and results show that this flavour of Weekly "Adaptive" DCA consistently outperforms classic DCA in 3 years periods by 8% and 26% for BTC and ETH respectively, considering all 3 year periods (sliding window) from January 2017 until May 2022. Moreover, if we followed this strategy of investing 100+F&G(t) USD every week, instead of 100 USD every week for the last 3 years, our wallet would be worth around 6'000 USD and 20'000 USD more for BTC and ETH respectively, by only adding 1'000 USD to our total final investment!
Of course, there are countless heuristics that can and will be made, and some of them may perform better than the one showcased here. Everything you see here comes out from my work that you can find in this this repo.
Thank you for spending your time reading until this point! If these numbers got your attention, the full article is here down below.
PermalinkAdaptive DCA with Fear and Greed Index
PermalinkWhat is DCA (Dollar Cost Averaging)
Dollar Cost Averaging (DCA) is an investment strategy in which an investor purchases a target asset using a fixed amount of money at regular intervals.
Example: Every first Sunday of the month, Bob buys the equivalent of $100 of BTC, regardless of its price.
PermalinkPros
While DCA may be suboptimal for a rational investor that aims at buying low and selling high trying to time the market, it offers a set of rationales for its use:
- Simplicity: DCA can be implemented by any investor, no matter its level of experience or knowledge.
- Accessibility: Small investors using DCA for the long term accumulation of an asset do not need to expose big amounts of capital all at once, and they probably do not have it anyway. They can instead pour into the market small quantities at their preferred pace (e.g. part of their monthly salary savings)
- Peace of Mind: DCA reduce investor's sense of responsibility for a choice, which reduces the emotional involvement (anxiety caused by either regret for bad outcomes or joy for good outcomes caused by the short term volatility).
PermalinkCons
On the other hand, DCA also has its drawbacks:
- Markets tend to go up: On the long term the market tends to go up. While lump sums may suffer from bad timing in the short term (e.g. buying the top at the end of a bull market), on the long term they will provide a better return than DCA, which averaged the price over the overall uptrend.
- Investor must still choose wisely: DCA removes the "time the market" responsibility for the investor, but it doesn't assolve him from choosing a good investment. At the end of the day, there will be a positive return only if the final asset price is above the average buy price. It is vital that the asset appreciates in the long term.
- It doesn't account for world's information: Knowledge of what's happening in the world at a specific time in history provides the investors with information that can help decision making. E.g. market dips or bearish periods represent a better time to enter the market when compared to periods where the asset reaches his ATH.
PermalinkCan we improve DCA?
If there were a proven method to "time the market", or a way to go back in time, buy and HODL (buy a lump sum and keep it no matter what happens) we wouldn't be here talking about DCA.
Since it is not the case, DCA is what we have to confidently enter the market at any time regardless of the current situation.
Now the question is: can we use available world information to consistently improve our investment performance over time?
PermalinkFear and Greed Index
PermalinkWhat is the F&G Index
As very well explained in the Cypto Fear and Greed Index website, crypto market behaviour is very emotional. People tend to get greedy when the market is rising which results in FOMO (Fear of missing out). Also, people often sell their coins in irrational reaction of seeing red numbers. Fear and Greed Index, tries to save you from your own emotional overreactions.
Fear and Greed uses two simple assumptions:
- Extreme fear can be a sign that investors are too worried. That could be a buying opportunity.
- When Investors are getting too greedy, that means the market is due for a correction.
PermalinkCorrelation with Crypto Prices
Are F&G assumptions backed by the actual price movement of our assets? Lets see its correlation with BTC and ETH prices in USD:
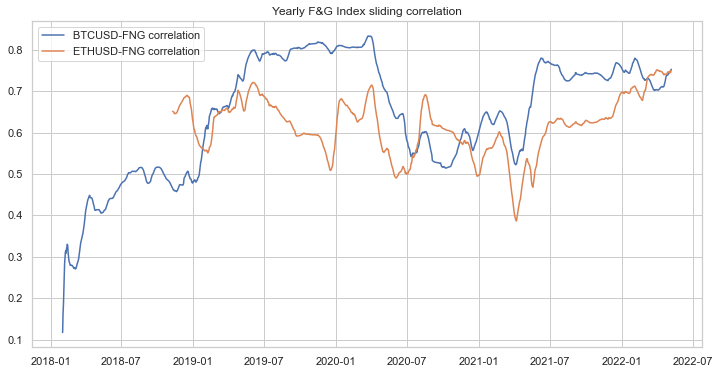
We can notice a strong positive correlation, remaining around its all-time-highs between 0.7 and 0.8 since last year.
If this chart doesn't tell you much, have a look at the following ones:
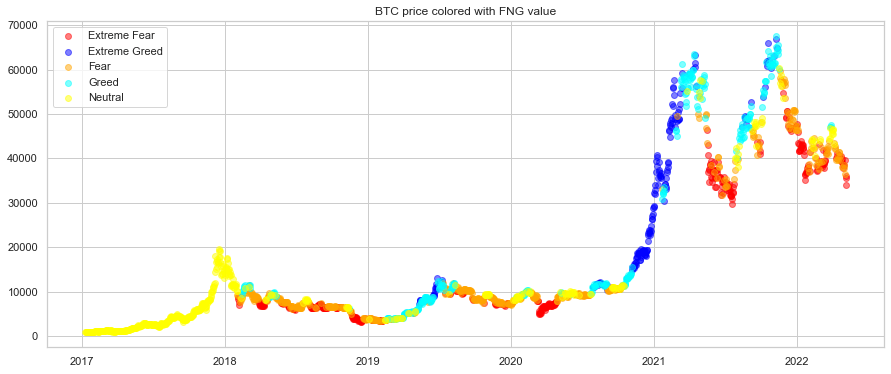
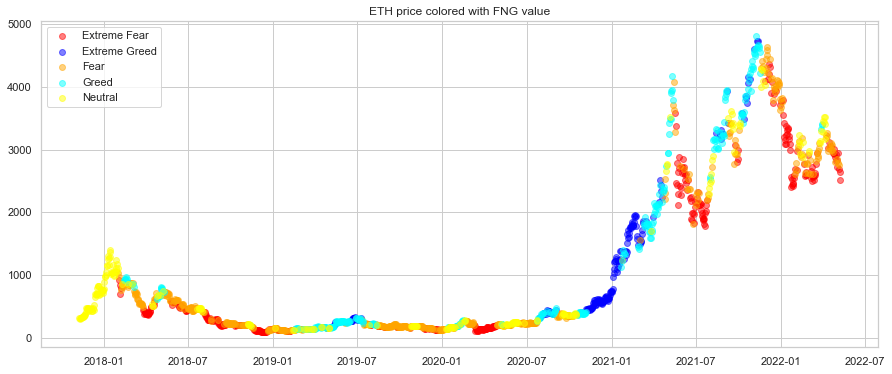
We can clearly see how blue regions highlight crypto bull runs, as well as red regions highlight moments that follow price crashes or long bearish periods that precedes bull runs. This suggests that F&G Index could be an effective indicator for our use case.
PermalinkDCA + F&G = ?
With DCA we do not time the market, we keep buying on a regular frequency. However, we can slightly adapt the concept and think of tweaking the amount from time to time depending on environment conditions. In this case our environment is represented by the F&G Index.
Instead of putting the same amount of money every time, increase or decrease the amount according to the (inverse) FNG Index as stated in the TL;DR:
When it's DCA day:
- If F&G indicates "Extreme Fear", buy 2x the DCA amount
- If F&G indicates "Fear", buy 1.5x the DCA amount
- If F&G indicates "Neutral", buy the default DCA amount
- If F&G indicates "Greed", buy 0.5x the DCA amount
- If F&G indicates "Extreme Greed", do not buy.
PermalinkAnalysis & Comparison
In this section 3 strategies will be compared:
- Monthly DCA: Buy every 16th of the month
- Weekly DCA: Buy every Tuesday of the week
- Weekly Adaptive DCA: Buy every Tuesday of the week
Instead of giving only the numbers of the last 3 years backtest, I thought it would be fairer to compare the strategies over sliding periods of different lengths, so that we can see how each strategy behaves in long (2 to 3 Years) and short terms (6 to 12 months).
A performance point is computed by backtesting all the strategies over a single period of [180, 365, 730, 1100] days. Date range is then shifted by one week, a new period is obtained, a new performance point is computed, and so on.
Performances are then grouped by strategy and by period HODL Performance, that is the performance of the asset if we bought the first day of the period and sold the last day of the period.
PermalinkBacktest Results (BTC)
Permalink1 Year Periods
PermalinkAbsolute
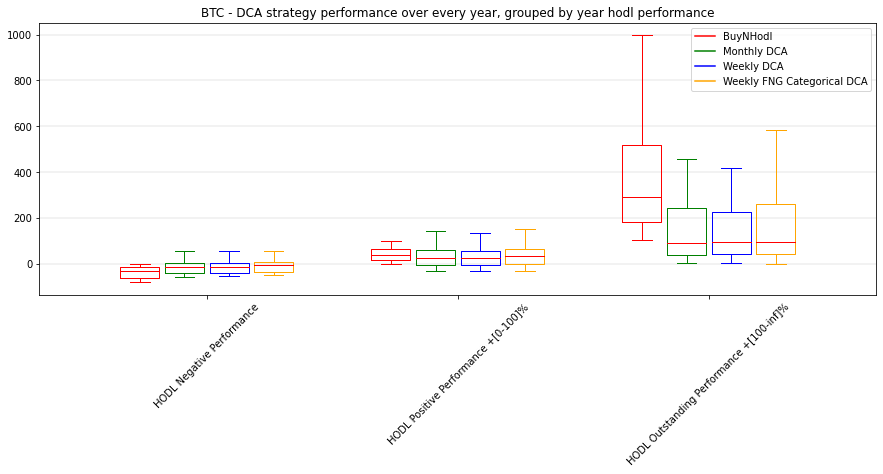
What this plot tells us:
- Negative periods (i.e; close price of the first day is higher than the close price of the last day) definitely affect HODLing and DCA, but DCA tends to perform better and in some cases even give a positive performance
- Good periods (i.e; close price of the last day is up to twice as higher as the close price of the first day) see a similar performance of both HODL and DCA approaches, there is a small chance that DCA performs even better
- Outstanding periods (i.e; price outbreak leading to a close price of the last day at least twice as higher than the close price of the first day) definitely reward HODLers with a median performance of +300%, while DCAs have their median performance sitting around +100%
PermalinkCompared to HODL
Above the red dotted line means that the strategy outperformed HODLing.
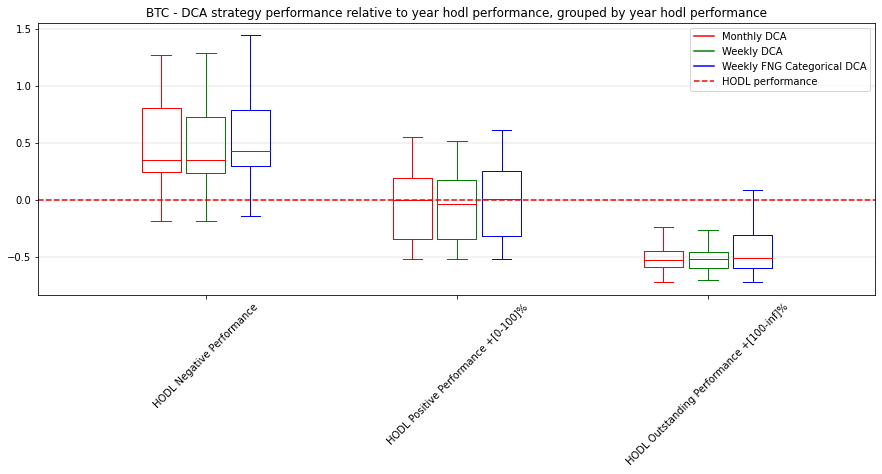
What this plot tells us:
- Negative periods see DCA outperforming HODLing most of the times, with the wallet evaluated between 25% and 50% more.
- Good periods can see any of the two approaches outperforming the other
- Outstanding periods see DCA having its wallets evaluated between 25% and 50% less than HODLing wallets.
Some additional statistic:
- Classic DCA outperformed HODLing in 37% of all the 1 year spans from January 2017 until today
- Adaptive DCA outperformed HODLing in 42% of all the 1 year spans from January 2017 until today
- Adaptive DCA outperformed HODLing in 96% of all the 1 year spans from January 2017 until today registering a negative price change
PermalinkNumbers
Average performances in 1 year periods compared by strategy
| strategy | vs. Classic DCA | vs. HODL | vs. Median DCA | vs. Worst DCA |
| BuyNHodl | 0.132017 | 0.0 | 0.118766 | 0.132017 |
| Monthly DCA | 0.0132504 | -0.118766 | 0 | 0.0132504 |
| Weekly DCA | 0 | -0.132017 | -0.0132504 | 0 |
| Weekly FNG Categorical DCA | 0.05615 | -0.0758668 | 0.0428996 | 0.05615 |
- DCA underperform HODLing by around 13% average on periods of 1 year length
- Our adaptive DCA strategy underperforms HODLing by around 7% average on periods of 1 year length
- Our adaptive DCA strategy outperforms classic DCA by 5.6% average on periods of 1 year length
Permalink3 Years Periods
PermalinkAbsolute
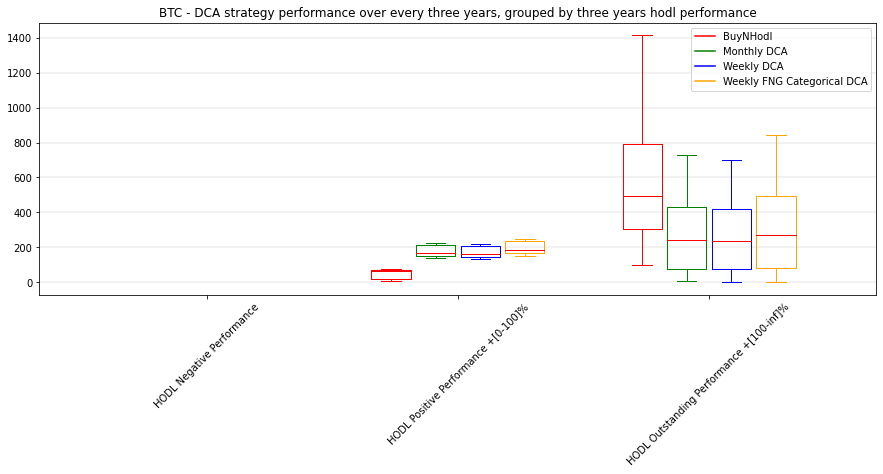
What this plot tells us:
- Negative periods of 3 years do not exist for the BTCUSD pair
- Good periods see DCA consistently outperforming HODLing
- Outstanding periods definitely reward HODLers with a median performance of +500%, while DCA performs with a median performance sitting above +200%
PermalinkCompared to HODL
Above the red dotted line means that the strategy outperformed HODLing.
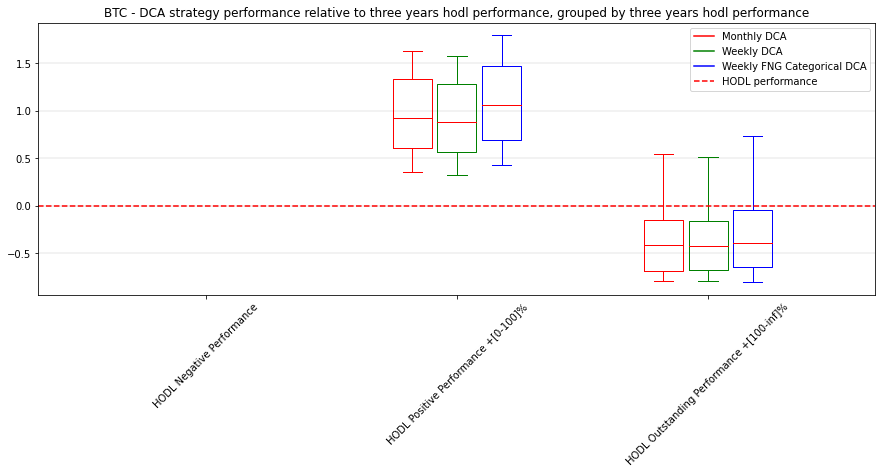
What this plot tells us:
- Periods of 3 years having "just" a +100% price increase see DCA heavily outperforming HODLing by having twice as much value
- Outstanding periods see DCA having its wallets evaluated between 25% and 50% less than HODLing wallets.
Some additional statistic:
- Classic DCA outperformed HODLing in 20% of all the 3 year spans from January 2017 until today
- Adaptive DCA outperformed HODLing in 26% of all the 3 year spans from January 2017 until today
- There are no 3 year spans with a negative price change for bitcoin.
PermalinkNumbers
Average performances in 3 year periods compared by strategy
| strategy | vs. Classic DCA | vs. HODL | vs. Median DCA | vs. Worst DCA |
| BuyNHodl | 0.304265 | 0.0 | 0.29035 | 0.304265 |
| Monthly DCA | 0.0139153 | -0.29035 | 0 | 0.0139153 |
| Weekly DCA | 0 | -0.304265 | -0.0139153 | 0 |
| Weekly FNG Categorical DCA | 0.0798486 | -0.224416 | 0.0659333 | 0.0798486 |
- DCA underperform HODLing by around 30% average on periods of 3 year length
- Our adaptive DCA strategy underperforms HODLing by around 22% average on periods of 3 year length
- Our adaptive DCA strategy outperforms classic DCA by almost 8% average on periods of 3 year length
If you are looking for the same plots and information for ETH, you will find them in my repo
PermalinkConclusions
Some consideration for us, small retail investors:
- We are not provided with a time machine, so we can't travel to 2015 and buy BTC for 200 USD
- We might not have the liquidity for a big investment right now, but we might have a job income stream generating savings each month
- We are facing a moment of uncertainty (2nd of June 2022 time of writing, people is arguing whether we reached the bottom at 30K or if we still have to enter a real bear market with bottoms at 25K, 22K, 19K or even 8K)
- Going all-in now could result in short-mid term losses that will heal only in the next bull market, that might take up to 3 years to come, depriving us from the invested liquidity until that moment
- Accumulate our capital waiting for a lower bottom is risky as well, as it could remain above 30K and take off again
DCA is a no-brainer solution that offers the investor the possibility to remove the doubt of "when", and once we have set the quantity to invest periodically it removes also the question of "how much". The price falls? Perfect, we will lower the average buy price. The price grows? Perfect, our investment will grow. This comes with the trade-off of not having the same ROI of lump sum investing in case prices skyrocket again.
Tweaking the amount from time to time by looking at the F&G Index does not increase the complexity of the approach, but experiments show that it can increase the returns already starting from a 1 year horizon. I'll personally give it a try!
Thank you for reading! It would be great to know what you think in the comment section below. Please like and share if it is helpful in any way!
Cheers!
Denis
Disclaimer: This article is for informational and entertainment purposes only, it doesn't represent any kind of financial advice. I myself am not a financial advisor! This approach is presented with past market data, which may be very different from what the future holds for us.